Data Mart and Data Warehouse

As I mentioned in the previous post, Data warehouses are for data analysis, which is becoming a hot topic these days. So, in this post, let me explain about Data Marts which are part of data warehouse.

A data warehouse can have many data marts, and each data mart can answer one general analytics question. Data from various sources are cleaned, and prepared in well-structured data warehouse. However, these cleaned yet raw data cannot explain the business questions. Therefore, transforming data into information is required and this is where raw data from data warehouse is converted into meaningful information which will be stored in the data mart.

Usually, each data mart has one data schema. In each schema, there is one fact table and multiple dimension tables. The fact table contains the measures for business question and the dimension tables are the dimensions for the measure from the fact table.

There are 2 types of data schemas: Star schema and Snowflake Schema.

Star Schema
Screen Shot 2015-01-26 at 7.20.06 pm

Star schema is simple. so it is fast in loading data. However, it is impossible to use hierarchical dimensions. Since the hierarchy is not allowed, the data contains duplicates.

For example, compare these 2 data of sales at a departmental store.
order001 | $23.9 | Branch A | New York | USA
order002 | $99.99 | Branch B | New York | USA

The location data is duplicated. If there are a lot of branches in New York, and as well as in the whole USA, there will be a lot of New Yorks… and USA, which takes a certain amount of space in each data line.

Snowflake Schema

The snowflake schema is like its name says, it is in snowflake shape with branches for the hierarchies.

snowflake

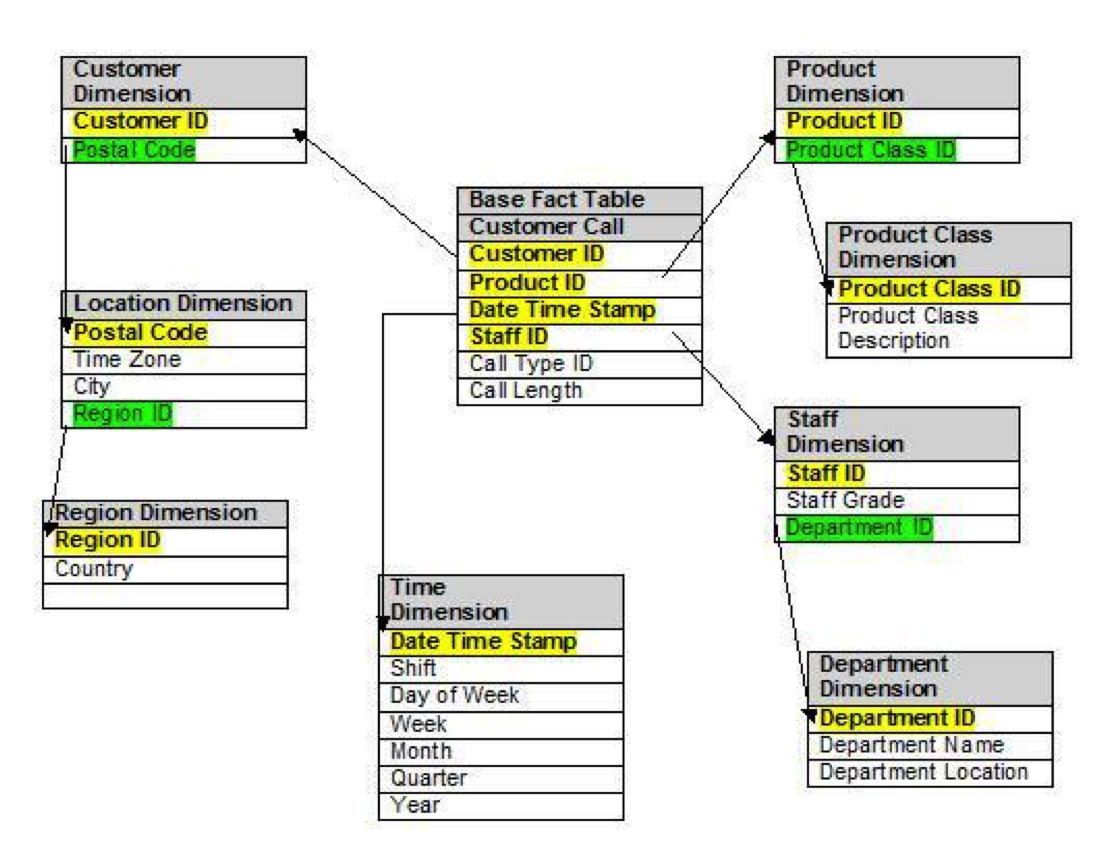
It basically saves the space of data like New York and USA in the previous example. So, it will save space. However, it has primary keys to link to hierarchical dimensions. This will delays the response time because of joints but there are less data to go through.

So, which schema to use and which is better?

My only ansewer is depends.

it is based on the business needs and nature of your business question that this fact table has to answer. So, if the requirement is only the general questions, star scheme is a better choice but again it just depends on how you will use this data mart.

Hope this post explains you well. If you have any question, please email me or comment below.


Data Warehouse

What is Data warehouse?

Data warehouse

is a long term storage of data, which is ready for business analysis(BI).

Actually, data warehousing is the basic of Business Analysis, since it has done the low level tasks such as data storing, managing, organizing and maintaining. The data in the data warehouse is ready to use in business Analysis and get meaningful trends to improve the business.

Basically, data warehouse is like a warehouse that stores all the enterprise data systematically so that it is easier in retrieval. Data warehouse is different from the databases used for regular daily transactions of a business process. It is at the enterprise level that integrates data from different data sources: can be structured databases of different applications, or unstructured like social media sources. Data warehouses handles a huge amount of data from long term while regular application databases clears in every 6 months or 2 years.

Data warehouses are used for analysis purpose, so the structure and design is very important in maintaining the large amount of data.

Indexing in Data Warehouse

Indexing is almost a must in regular app databases because of its ability to improve the performance of the system. However, in Data Warehousing, whether we should use indexing or not and when to use are very difficult and dubious questions. Unlike the day-to-day recording databases, regular update is not necessary, joining is not required. In such cases, indexing can hinder the process because of loading the unnecessary indexing process to a large amount of data. So it depends on the business requirement where to use indexing and where not. Therefore, heavily indexing like in application databases is something to avoid in data warehousing.

Generally, Data warehouses are structured in relational design.

Properties of Relational Database Management System (RDBMS)

In RDBMS, all the objects are defined as entity and later structured as table, which is the basic objects of relational model.

Each entity has

1. primary key, which is the unique identifier of an entity.
2. non key element or attribute that describe or characterize information about the entity.
3. (optional) foreign key which comes from parent-child relationship between a pair of entities.

There are also Relationships among entities, which are the business rules associating the entities together.

The goal of Data Modeling is to completely and accurately reflect the data requirements and business rules for handling that data so that the business can perform its functions effectively.

Normalization

Normalization is the process of efficiently organizing data in a database. There are two reasons of the normalization process:

  • Eliminating redundant data, for example, storing the same data in more than one tables.
  • Ensuring data dependencies make sense.

Both reasons aim to reduce the amount of space a database consumes and ensure that data is logically stored. Normalization consists of a series of guidelines that help guide you in creating a good database structure.

Normalization guidelines are divided into normal forms; think of form as the format or the way a database structure is laid out. The aim of normal forms is to organize the database structure so that it complies with the rules of first normal form, then second normal form, and finally third normal form consequently.

In practice, many organizations follow until third normal form and the data structure is organized enough in that stage.

First Normal Form(1NF) : requires two conditions _ that every entity have a primary key that uniquely identifies it and that the entity contain no repeating or multivalued groups. Each attribute should be at its lowest level of detail and have unique meaning and name.

Second Normal Form(2NF) : requires the data to be in 1NF prior to data breakdown and every nonprimary attribute must be dependent on the entire primary key for its existence.

Third Normal Form(3NF) : requires the data to be in 2NF prior to further data breakdown and the nonkey fields must be dependent on only the primary key and not on any other attribute in the entity for the existence.

Finally, normalization:

  • Removes data inconsistencies since data is stored only once, thus eliminating the possibility of conflicting data
  • Diminishes insertion, updating and deletion anomalies because data is stored only once
  • Increases the data structure stability because attributes are positioned in entities based on their intrinsic properties rather on specific application requirement.

What is Relational Database Management System (RDBMS)?

A Relational Database Management System(RDBMS) is a Database Management System(DBMS) that is based on relational models. The database is structured in a way that all the tables are related in the database. It also makes the data easier to understand and use.

Many major commercial DBMS like oracle, IBM’s DB2 and Microsoft’s SQL Servers are using structured in relational design. Besides from commercial database systems, there are 3 main Opensource implementations: MySQL, PostgreSQL and SQLite.

To read about the properties of RDBMS, click here.

Installing iReport and adding JasperReports to your netbeans

You may use your different IDEs, but since I am using netbeans for my current project, I will share you how to use iReport with your netbeans.

For iReports, as I mentioned in the previous post, you can use the standalone app as well as the plugin for netbeans. In installing iReports and jasperReports, you need to be careful with the version of each library. In my case, I uses the plugin instead of standalone version. iReport version is 5.5.0 and JasperReports is version 6.0.0. To be able to use, I added a few libraries like this.

Capture

For iReport, go to netbeans’ Tool > Plugin > Downloaded > Add plugins and add the downloaded plugin files.

I had problems while installing because of the versions of libraries and jdk. So be careful with it and Have fun!

JasperReport LifeCycle

Let’s learn about the life cycle of a report.

When you design using iReport, it is creating JRXML file, which is a XML file that contains about definitions of the structure of the report. In this stage, it is designing pure visual, so you don’t need to care about the real structure of XML file.

After designing, the XML file is needed to be compiled before executing a report. When compiled, a binary object, .jasper file, is generated from .jrxml file.

When the compilation is done, a report can be executed to designated file format. During execution, .jasper file together with a data source is passed to JasperReports to generate a required report.

JasperReports is flexible for types of data sources. The data source can be SQL Query, XML file, csv file, HQL query or collection of javabeans. You can even write your own customized data source to link to JasperReports.

Along the report generating process, iReport will include in JRXML designing, Jasper compiling, Report executing, Document exporting and Visualizing.

JasperReport Getting Started

I just started learning how to use JasperReports and I think this is one of the best ideas to share what I learnt.

What is Jasper Report?
Jasper Reportsis an open source Java reporting tool that can generate dynamic content for a variety of targets, such as: screen, a printer, into PDF, HTML, Microsoft Excel, RTF, ODT, Comma-separated values or XML files.

It cannot run on its own and must be embedded in another client- or server-side Java application.

What is iReport?
iReport is an OpenSource program that can create complex reports which can use every kind of java application through JasperReports library. It is written in 100% pure java and it is distributed with its source codes according to the GNU General Public License. It is a visual tool to obtain XML files for JasperReports. It provides a WYSIWYG environment to design reports.

iReports is the Visual Report Designer for JasperReports library, which is the open source Java reporting library. You can also use JasperReports Server instead of JasperReports if you don’t want to create custom application for reports. JasperReports is easy to integrate with Java application.

JasperServer provides a web based interface to manage, schedule, and run the reports; a repository to store all the report resources like images, fonts, data sources and much more; a security service to decide who can execute which report; and a web services API to execute the reports from external applications (so you can generate reports from any kind of environment, like PHP or .NET).

In the big picture, iReport Designer allows you to design reports, JasperReports allows to execute them and generate output in a Java application, and JasperServer allows both end users and external applications to access, view, and publish your reports securely. JasperServer also makes reports interactive by adding drill down and drill up capabilities to your documents.

You can use iReport in two different ways-
a. Standalone installation
b. Using Plugins

This is all for now. If you have any question, please leave comment. To get further update, please follow this blog.